/
Data Usage
Data Usage
- Former user (Deleted)
- Aleksandra Klusińska (Unlicensed)
Owned by Former user (Deleted)
Last updated: Apr 30, 2019 by Aleksandra Klusińska (Unlicensed)
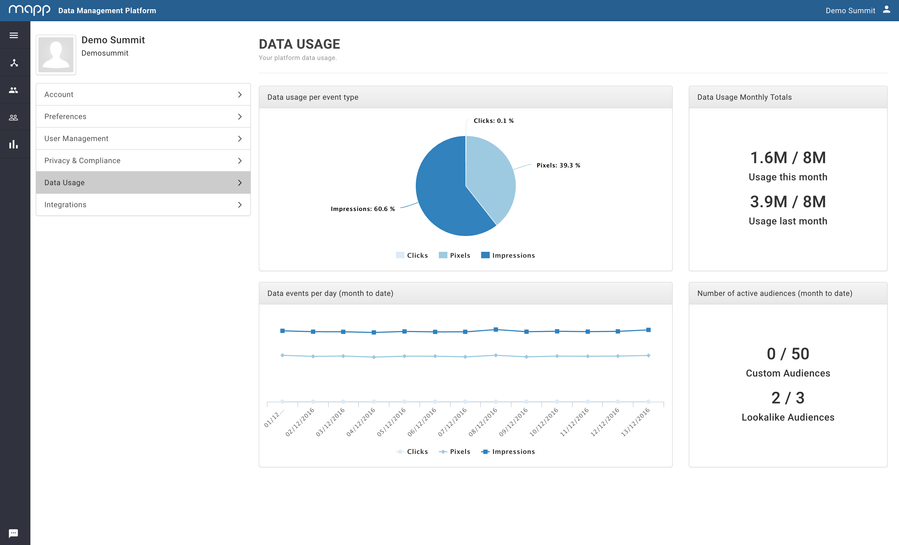
Data Usage gives you more insights in the amount of data events you are using. Within Data Usage there are several graphs.
- Data usage: this graph shows the amount of data events you have used and the amount of data events you have available for the current month. Please note that this graph is only available if there’s a limit on the amount of data events you are collecting
- Data usage per event type: this graph shows the distribution of the event types of the data you are collecting.
- Data events per day (month to date): this graph shows you the daily amount of data events being collected.
- Number of active audiences (month to date): this graph shows you the number of audiences which are still being updated.
, multiple selections available,
Related content
Data Collection
Data Collection
More like this
Analytics
Analytics
More like this
Data Collection Configuration
Data Collection Configuration
More like this
Audience Insights
Audience Insights
More like this
Insights
Insights
More like this
Real-time Dashboard
Real-time Dashboard
More like this