Insights
This section covers all information about the Data Collection Insights page.
| Contents on This Page |
|---|
Description
Data Collection Insights give you a detailed view of how your pixels, segments and custom events are performing.
Features
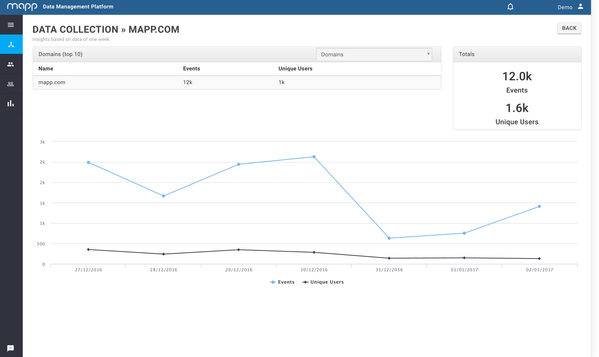
Access Data Collection Insights by clicking on the 'graph' button on the Data Collection Overview.
The reports shows you the following data:
- Domains / Segments / Custom (Success) Event (top 10): The top 10 domains, segments or Custom Events (depending on the filter) the pixel is collecting data on, including the pixel loads and unique users of that domain, segment or custom event.
- Totals: The total pixel loads and unique user for the pixel you selected.
- Trendline: The trendline shows the amount of pixel loads and unique users per day.
All data is based on estimated for one week.
, multiple selections available,

