Real-time Dashboard
- Former user (Deleted)
- Florian Wilhelm
This section covers all information about the Real-time Dashboard.
| Contents on This Page |
|---|
Description
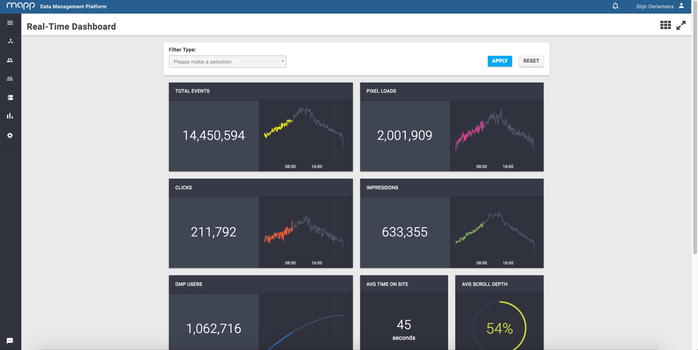
Monitor your most important activities in real time. The Real-Time Dashboard lets you monitor your essential activities across one or more platforms in real time. With less than 50 millisecond latency, you can instantly see and react to your data.
The Real-Time Dashboard is in UTC time zone.
New campaigns will be visible within 30 minutes after the campaign is set live at your DSP.
Features
Filters
Use the filters at the top of the screen to display activities for one pixel, audience, campaign or advertiser.
Customization
You can customize the dashboard by dragging and dropping the blocks to different parts of the screen.
Dashboard components
| Name | Capability |
|---|---|
| Total Events | Measures and visualizes the amount of total events throughout the day and also does this for the events of yesterday. The number on the left side of the graph represents the total amount of events processed by the DMP today. |
| Pixel Loads | Measures and visualizes the amount of Pixel loads throughout the day and also does this for the pixel loads of yesterday. The number on the left side of the graph represents the total amount of pixel loads processed by the DMP today. |
| Impressions | Measures and visualizes the amount of impressions served throughout the day. The number on the left side of the graph represents the total amount of impressions served today. |
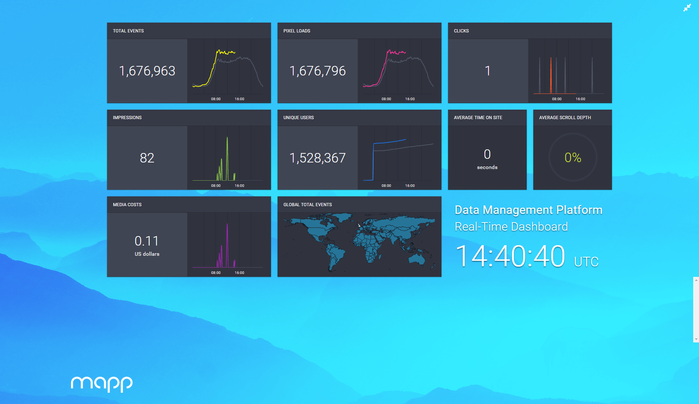
| Global Total Events | Measures the total amount of events per country and visualizes this in the form of the color blue. The lighter the blue the more total events a country has processed. |
| Clicks | Measures and visualizes the amount of clicks throughout the day and also does this for the clicks of yesterday. The number on the left side of the graph represents the total amount of clicks processed by the DMP today. |
| Media Costs | Measures and visualizes the media costs throughout the day. The number on the left side of the graph represents the total amount of media costs processed by the DMP today. |
| DMP Users (Uniques) | Measures and visualizes the amount of unique users throughout the day and also does this for the unique users of yesterday. The number on the left side of the graph represents the total amount of unique users processed by the DMP today. |
| Average Time on Site | Shows you the average time on site expressed in seconds. |
| Average Scroll Depth | Shows you the average scroll depth as a percentage of the whole page. |
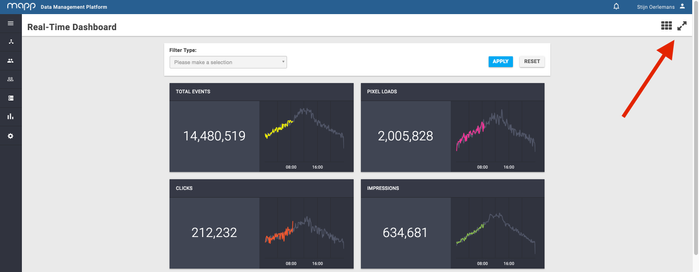
Full screen mode
You can enable the full-screen mode by clicking on the 'spreading arrows' icon on the upper right side of your screen.
The screenshot below displays the Real-time Dashboard in full-screen modus.
Mobile Dashboard
Also install the Mapp app which includes the real-time dashboard: https://play.google.com/store/apps/details?id=com.flxone.mobile. Sign in with your Mapp DMP credentials and use the real-time dashboard wherever you are.