Features RC
- Former user (Deleted)
- Florian Wilhelm
This section covers all information about the features within the U.I. of Report Central.
| Contents on This Page |
|---|
Description
Report Central has got multiple features to filter, save and display your data. The following pages explain how to use these features:
- Dimensions and Measures
- Configuration
- Charts
- Date Range
Features
Dimensions
Report Central will use all your data by default. In some cases it makes more sense to filter certain dimensions to limit the amount of information in your report. You can do this by clicking on the filter button to the left of the dimension name. There are three kind of dimension filters: filters for exact matches, filters for pre-populated results and filters for the function equals and contains.
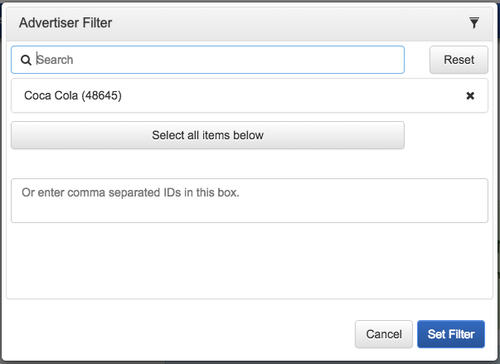
Filters For Exact Matches
Once you click on the filter button for filters with exact matches (e.g. Advertiser, Campaign, etc.), a new window will pop up. This window allows you to search for specific items. You can select items by clicking on the search results or select all search results by clicking on the button: ‘Select all items below’.
You can also select multiple items by entering the IDs in the box below the search results.
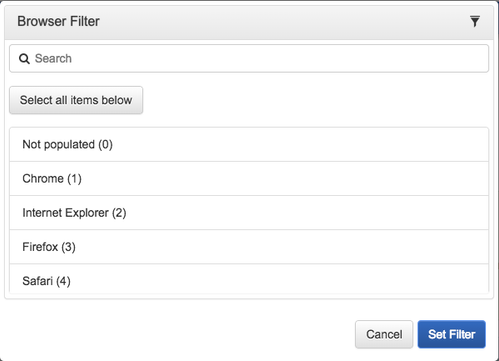
Filters For Pre-Populated Results
Once you click on the filter button for filters with pre-populated results (e.g. Browser, Date, etc), a new window will pop up. This window allows you to search and select the displayed items. You can select items by clicking on them or select all results by clicking on the button: 'Select all items below'.
Filters For The Function Equals and Contains
Once you click on the filter button for filter for the function equals and contains (e.g. Site Domain, Referrer URL, etc.), a new window will pop up. This window allows you to select either Equals or Contains. Enter the data in the box and separate multiple entities by commas or new lines.
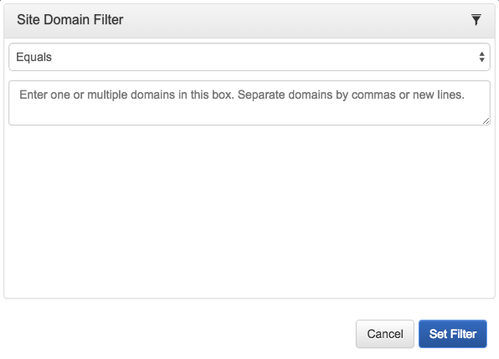
After you have made your selection, click ‘Set Filter’ to apply the filter to your report.
Even if you don't select a dimension to appear in the report, the filters you have set will still be applied.
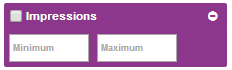
Measures
In some cases, you may not want to see all of the data related to specific measures. You can set a minimum and maximum to limit the amount of visible data.
- Find the measure.
- Click on the '+'.
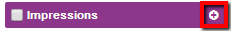
- Fill in minimum and/or maximum to limit the amount of data you want to display.
Even if you don't select a measure to appear in the report, the filters you have set will still be applied.
Date Range
Within Report Central there are multiple options in terms of date range. You can choose to view the data for the following date ranges:
| Date Range | Displayed Data |
|---|---|
| Today | Today starting from 0:00 UTC (GMT+0). |
| Yesterday | Yesterday starting from 23:59 until 23:59 UTC (GMT+0). |
| Last 7 Days | The last 7 days including today. |
| Last 30 Days | The last 30 days including today. |
| This Month | This month starting from the 1st of the current month, up to and including today. |
| Last Month | Last month starting from the 1st of last month through the last day of last month. |
| Custom Range | Select a custom date range. The maximum time frame depends on the data collected by Mapp and your contract details. |
Charts
Within Report Central, you can choose from a variety of graphics to display your data. Depending on the dimensions and metrics you choose, the options for graphics will change.
There are multiple graphics available within Report Central. Each has its own conditions as described below. The system will automatically pick the most suitable graphic depending on the chosen dimensions and measures. If you prefer a graphic that is different from the suggested option, simply click on ‘Chart’ and select another chart.
| Graphic | Condition |
|---|---|
| Bar Chart | One dimension and at least one measure. |
| Multi Bar Chart | Two dimensions and at least one measure. |
| Line Chart | One time dimension and one average measure. |
| Multi Line Chart | One time dimension and two average measures. |
| Stacked Chart | Two dimensions (one of these dimensions must be a time dimension) and one non-average measure. |
| Bar + Line Chart | One time dimension and one measure (one of these measures must be an average measure). |
| Heat Map | Two dimensions and at least one measure. |
| Scatter Chart | One dimension and two or three measures. |
| Map | The dimension 'Geo Country' and one measure. |
A time dimension is one of the following dimensions: 'Date', 'Hour' or 'Date and Hour'.