...
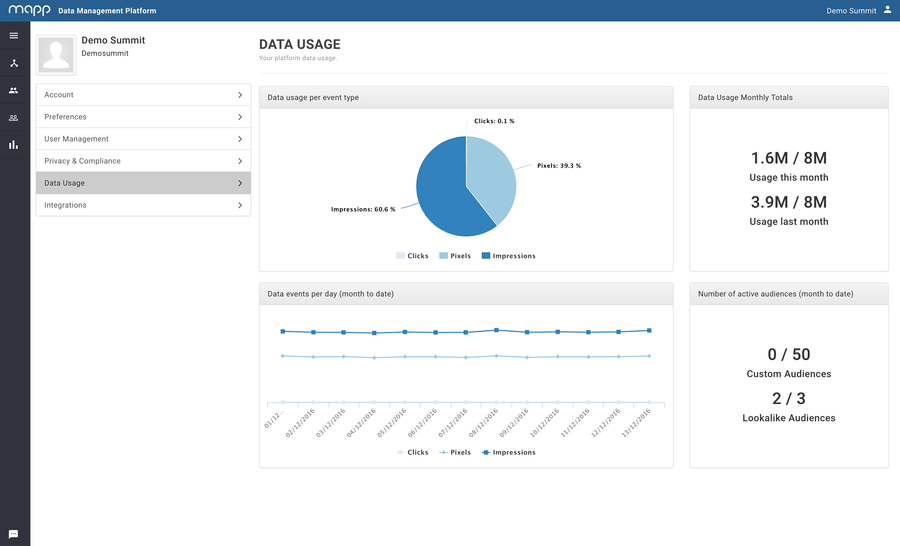
- Data usage: this graph shows the amount of data events you have used and the amount of data events you have available for the current month. Please note that this graph is only available if there’s a limit on the amount of data events you are collecting
- Data usage per event type: this graph shows the distribution of the event types of the data you are collecting.
- Data events per day (month to date): this graph shows you the daily amount of data events being collected.
- Number of active audiences (month to date): this graph shows you the number of audiences which are still being updated.